Part 4 of the series addresses our ERP value stream mapping
techniques. With it we go beyond traditional value stream mapping, in that we
combine the material and information flows with specific settings we have to
configure in the ERP system so that it can support the flow we intend to obtain.
Since we often implement or optimize SAP ERP systems, I’d like to demonstrate
SAP value stream mapping here.
Value stream mapping, also known as "material- and
information-flow mapping", is a lean-management method for analyzing the
current state and designing a future state for the series of events that take a
product or service from the beginning of the specific process, until it reaches
the customer. A value stream map is a visual tool, that displays all critical
steps in a specific process, and easily quantifies the time and volume taken at
each stage. Value stream maps show the flow of both materials and information,
as they progress through the process. The difference between a value stream and
a value chain, is that a value stream focuses only on areas of a firm, that add
value to a product or service, whereas a value chain refers to all the
activities within a company.
SAP value stream mapping follows the same principles and
conventions that traditional value stream mapping does. Additionally, it adds SAP
specific data and settings. On an SAP value stream map you can document lot
sizing procedures and MRP type from the material master, work center category
and capacity related information from work centers, identify production versions
and routings to be used, define operation data from the routing with its cycle
times, and much, much more. A finished SAP value stream map can serve as a
complete documentation for a system architect, to set up all the functions,
features and customizing settings, in order to run the value stream
repetitively and effectively with SAP.
Additionally, to traditional value stream mapping, SAP value
stream mapping adds pragmatism to the design process and allows for the
immediate realization of the theoretical design.
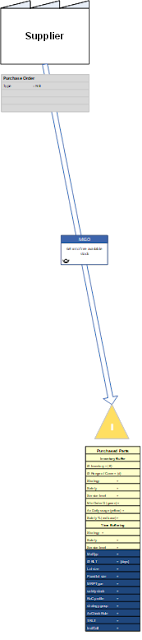
First you design the inventory points. These also serve as
de-coupling points as we will see later. An inventory point is defined in SAP
as a material master record. Without a material master record, you cannot post
a goods receipt of material into stock, and therefore, without a material
master in SAP, there is no inventory in SAP. A stock or inventory point in a
value stream map, is identified with a triangle and a capital I in it. Here we
add two boxes with data to the triangle, to maintain SAP specific inventory and
master data.
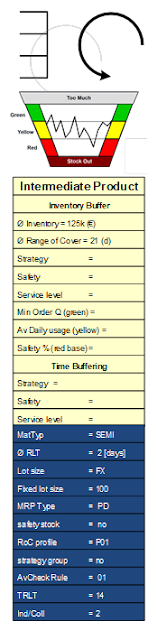
But inventory points must not be traditional stock alone. It
can also be a supermarket, as used in lean projects. If the flow is set up as a
self-organizing system, as in the case of Kanban or conwip, then we need a
supermarket, from which an order can pull. Notice the icon for supermarket is a
different one than the traditional stock point. However, the boxes below are
the same. Except that here, you may maintain control cycle data additionally to
the material master data.
Then we’ll design the material flow along work centers or
machines. Notice that the flow happens between two inventory points. Eventually
this flow will be described by a routing and then used in a production order.
From upstream, the left side of the flow, raw materials or semi-finished
product is issued and consumed to the order, and the downstream inventory point
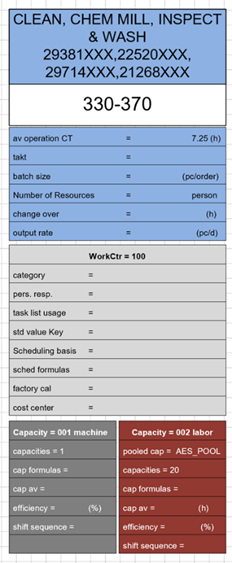
will receive the finished product from the order. Along the routing there are
work centers and the activities, or operations which are executed on those work
centers.
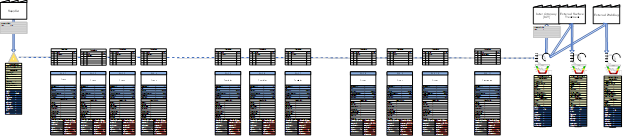
The work center box contains a description of the work
center, and the work center’s SAP identification code. The blue box underneath
the identification code contains performance data of the work center. Then
there are the work center specific data settings like the work center category,
standard value key, and the scheduling formulas, amongst other things, in the
grey box. Lastly, you can identify what type of capacity may be used on that
specific work center. Is it a labor capacity? A machine capacity? Or both. The
capacity itself then, is also described by the respective data box.
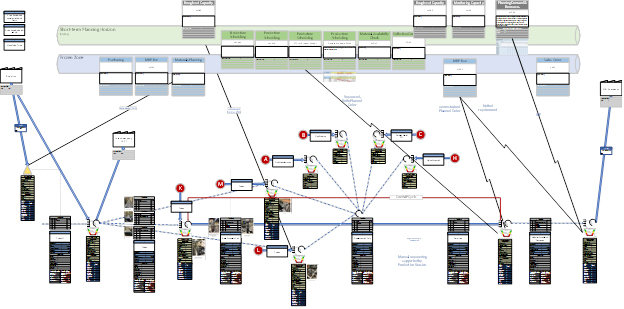
Finally, we can also add the information flow to the map. All
the planning, scheduling and monitoring activities are defined there.
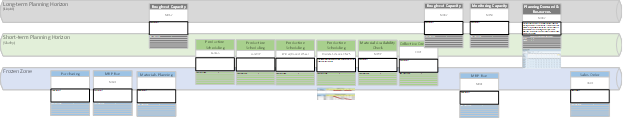
These SAP value stream maps can become quite elaborate and
detailed and therefore require a lot of effort to put together. We typically
plot them on big posters, hang them up on the wall in the war room and go
through various iterations as a team. The results are very rewarding in the
long run, as you can readily pinpoint inefficiencies and device some strategies
to improve all in one place.
Like mentioned before, if you put the work and focus into developing the SAP VSM, you’ll be compensated with a complete system documentation and a very solid basis for continuous improvements.
Getting Value and Results out of an ERP 1
Getting Value and Results out of an ERP 2
No comments:
Post a Comment
Note: Only a member of this blog may post a comment.