- solve broader reaching issues
- standardize
- renew
- make us look better, using the gold standard in IT
... and for a million other reasons. But when does anyone take the time to actually measure where you are and what was achieved with the implementation?
At bigbyte we created the Supply Chain Performance Indicator that looks at ten major measurements to benchmark how well your SAP investment drives your supply chain. Each measurement is supported by various KPIs and the final result - the SCPI or "Skippy" - visualizes the benchmark.
The ten areas of interest are:
1. Inventory Performance
2.
Service
3.
Automation
4.
Flexibility / Agility
5.
Lean Six Sigma
6.
Cost / Profitability
7.
Visibility / Transparency
8.
Information Maturity / Basic Data
9.
Competence
10. Organizational
Support
Inventory Performance
this KPI takes a deeper look into
- Average inventory holdings
- Dead stocks and how these relate to the averages and frequency of movements
- Safety stock holdings and resulting availability and dead stock
- Inventory turns
- Categorization (slow movers, new materials, ABC, XYZ)
The measurements may be retrieved with standard SAP LIS transactions, BI (BW) or the use of the Add-On Tools “MRP Monitor” and “Inventory Cockpit”. To achieve improvements in Inventory Performance, an effort to set meaningful policy, improving forecast accuracy, better planning methods in S&OP and production, a company could raise the benchmark significantly.
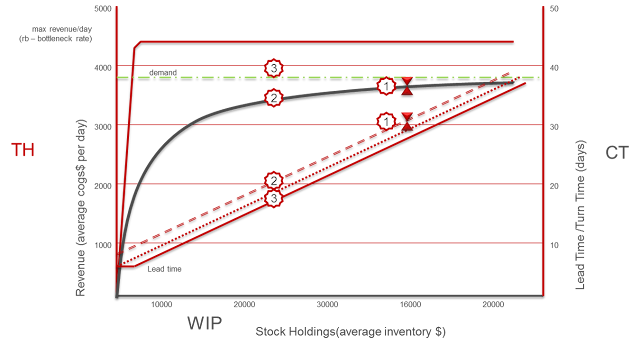
Once all reports are in we can perform ‘flow benchmarking’ and determine how well an organization is using inventory to deliver Throughput and short Cycle Times. Flow benchmarking uses Littl's Law to relate Revenue (Throughput) with average Inventory holdings (WIP) and Lead Times (or Cycle Times) and provides an excellent opportunity to calculate a third variable when two are measurable. Flow benchmarking shows how well materials flows and is an excellent tool to set a WIP cap in a pull system.
Service
Service can be measured as to how well customers receive product to their requested delivery date and how well promises are kept. But we can also measure the service level from production to the warehouse and the availability of bulk and packaging material to the packaging line. Of great importance is the consideration of a difference between a Make To Stock rating (the Fill Rate) and the Make To Order rating (Delivery Service, Delivery Ability, Delivery Reliability). The SAP Add-On 'Service Level Monitor' is an excellent tool to categorize and report on these Services.
Automation
The level of automation – using SAP functions – poses lots of improvement opportunities. Be it the automatic conversion of planned orders into a production program, automated procurement of packaging materials or the application of a method to perform regular policy setting and the resulting monitoring of exception messages, Most companies do not make enough use of standard tools available in the SAP functionality. The level of Automation could be greatly increased by implementing some of the advanced, standard functions available in the areas of Sales & Operations Planning, Materials Planning, Production scheduling and Procurement.
Flexibility / Agility
The degree of flexibility becomes apparent when looking at the way the planning (information) and material flow is designed. With the introduction of de-coupling or a inventory/order interface, and the resulting buffering of inventory before the final assembly or packaging lines, such flexibility can be achieved.
Using S&OP functionality with flexible planning of planning hierarchies and performing rough resource checks, the resulting forecast figures can be placed on an inventory point upstream from the final assembly or packaging lines. This would have the effect that the downstream lines can be scheduled with a demand driven ‘pull’ system and the resulting agility will increase service levels and drastically reduce safety stock or days of cover requirements.
The more often used method of placing an unchecked forecast on the finishing lines and the subsequent conveyance of every finished product forecast to the bulk level, leaves very little room for responsiveness to quickly changing demand. Very low flexibility to counteract forecast errors are compensated with changing the forecast of the near future. This poses a number of issues to the production scheduler and the additional problem of ever changing, “un-fixed” stock transport requisitions from the warehouse make it almost impossible to put together an agile production program.
Lean Six Sigma
A lean supply chain is defined by it’s low degree of producing or causing waste. As an example: the waste of overproducing finished goods to the warehouse can be induced by a high forecast error or a faulty transfer of demand. Additionally, ineffective planning procedures may lead to ineffective supply programs that produce lots of waste. Another form of waste lies in long cycle times. If, for example, production orders are released to the shop floor without performing all necessary steps – like an availability check for components, capacity leveling and proper sequencing of jobs – the orders remain on the line unprocessed and block valuable machine time and reserve raw or packaging material that other orders could use.
Six Sigma mostly measures defects and strives to introduce processes that will reduce the number of defects, in order to avoid waste and therefore achieve a lean supply chain with a high six sigma – or low number of defects for high quality in process and product.
A lot more effort is required to truly measure lean six sigma, but a lack of
- fitting scheduling methods
- high forecast errors
- ineffective transfer and placement of demand
- a good process to re-introduce byproduct into the process
- recipes with its possibility to perform quantity calculations and batch determination in a lean and effective way- measuring defects
- introducing a demand driven flow
lead to lots of waste and defects.
Profitability
Profitability is measured with standard FI and CO reports for Sales, Production and Procurement
Visibility / Transparency
A transparent supply chain is defined by the ability to quickly find inefficiencies and to pinpoint and find areas where exceptions occur. A good system to plan materials with policy setting and exception monitoring is conducive to a high degree of transparency.
Information Maturity / Basic Data
The basic data setup represents the most important driver of accuracy and efficiency for replenishment and planning policies. It also drives automation. Basic data includes material master, routes, work centers, resources and Bills of Material. It needs to be evaluated on a regular basis and changes must be coordinated between the various departments where it has an impact. The sum of all settings in the master (or basic) data represents a policy by which inventories and orders are filled, service levels are met and automation happens.
Very often there is a need for a concerted effort to keep master data clean, up-to-date and effective. A method needs to be put in place by which planners, schedulers and buyers will analyse, evaluate and update policies on a regular and continuous basis.
Competence
SAP usage competence is measured here. How much training for the user was received? What was the level of detail of the training? Is the system perceived to drive value? And is there user acceptance?
But we also need to measure how well general supply chain principles are understood.
Organizational Support
Further evaluations are necessary in order to determine the level of organizational support that is given to the SAP user. We consider of great importance that executives in the company, the people who made the decision to use SAP, are in full support of making the best use of the investment in SAP software. Therefore it’s of great value if the executives get involved to a fairly detailed degree and help support any improvement, sustainability and optimization projects around a better use of SAP software to drive the supply chain. This is a highly underestimated contributor to success.
Once all measurements are in, we can give an overall rating for each of the ten major KPIs and plot a spider diagram as seen below. The red line may depict the current performance, while the green line may give a target that needs to be achieved using various optimization efforts.
this KPI takes a deeper look into
- Average inventory holdings
- Dead stocks and how these relate to the averages and frequency of movements
- Safety stock holdings and resulting availability and dead stock
- Inventory turns
- Categorization (slow movers, new materials, ABC, XYZ)
The measurements may be retrieved with standard SAP LIS transactions, BI (BW) or the use of the Add-On Tools “MRP Monitor” and “Inventory Cockpit”. To achieve improvements in Inventory Performance, an effort to set meaningful policy, improving forecast accuracy, better planning methods in S&OP and production, a company could raise the benchmark significantly.
Once all reports are in we can perform ‘flow benchmarking’ and determine how well an organization is using inventory to deliver Throughput and short Cycle Times. Flow benchmarking uses Littl's Law to relate Revenue (Throughput) with average Inventory holdings (WIP) and Lead Times (or Cycle Times) and provides an excellent opportunity to calculate a third variable when two are measurable. Flow benchmarking shows how well materials flows and is an excellent tool to set a WIP cap in a pull system.

Service
Service can be measured as to how well customers receive product to their requested delivery date and how well promises are kept. But we can also measure the service level from production to the warehouse and the availability of bulk and packaging material to the packaging line. Of great importance is the consideration of a difference between a Make To Stock rating (the Fill Rate) and the Make To Order rating (Delivery Service, Delivery Ability, Delivery Reliability). The SAP Add-On 'Service Level Monitor' is an excellent tool to categorize and report on these Services.
Automation
The level of automation – using SAP functions – poses lots of improvement opportunities. Be it the automatic conversion of planned orders into a production program, automated procurement of packaging materials or the application of a method to perform regular policy setting and the resulting monitoring of exception messages, Most companies do not make enough use of standard tools available in the SAP functionality. The level of Automation could be greatly increased by implementing some of the advanced, standard functions available in the areas of Sales & Operations Planning, Materials Planning, Production scheduling and Procurement.
Flexibility / Agility
The degree of flexibility becomes apparent when looking at the way the planning (information) and material flow is designed. With the introduction of de-coupling or a inventory/order interface, and the resulting buffering of inventory before the final assembly or packaging lines, such flexibility can be achieved.
Using S&OP functionality with flexible planning of planning hierarchies and performing rough resource checks, the resulting forecast figures can be placed on an inventory point upstream from the final assembly or packaging lines. This would have the effect that the downstream lines can be scheduled with a demand driven ‘pull’ system and the resulting agility will increase service levels and drastically reduce safety stock or days of cover requirements.
The more often used method of placing an unchecked forecast on the finishing lines and the subsequent conveyance of every finished product forecast to the bulk level, leaves very little room for responsiveness to quickly changing demand. Very low flexibility to counteract forecast errors are compensated with changing the forecast of the near future. This poses a number of issues to the production scheduler and the additional problem of ever changing, “un-fixed” stock transport requisitions from the warehouse make it almost impossible to put together an agile production program.
Lean Six Sigma
A lean supply chain is defined by it’s low degree of producing or causing waste. As an example: the waste of overproducing finished goods to the warehouse can be induced by a high forecast error or a faulty transfer of demand. Additionally, ineffective planning procedures may lead to ineffective supply programs that produce lots of waste. Another form of waste lies in long cycle times. If, for example, production orders are released to the shop floor without performing all necessary steps – like an availability check for components, capacity leveling and proper sequencing of jobs – the orders remain on the line unprocessed and block valuable machine time and reserve raw or packaging material that other orders could use.
Six Sigma mostly measures defects and strives to introduce processes that will reduce the number of defects, in order to avoid waste and therefore achieve a lean supply chain with a high six sigma – or low number of defects for high quality in process and product.
A lot more effort is required to truly measure lean six sigma, but a lack of
- fitting scheduling methods
- high forecast errors
- ineffective transfer and placement of demand
- a good process to re-introduce byproduct into the process
- recipes with its possibility to perform quantity calculations and batch determination in a lean and effective way- measuring defects
- introducing a demand driven flow
lead to lots of waste and defects.
Profitability
Profitability is measured with standard FI and CO reports for Sales, Production and Procurement
Visibility / Transparency
A transparent supply chain is defined by the ability to quickly find inefficiencies and to pinpoint and find areas where exceptions occur. A good system to plan materials with policy setting and exception monitoring is conducive to a high degree of transparency.
Information Maturity / Basic Data
The basic data setup represents the most important driver of accuracy and efficiency for replenishment and planning policies. It also drives automation. Basic data includes material master, routes, work centers, resources and Bills of Material. It needs to be evaluated on a regular basis and changes must be coordinated between the various departments where it has an impact. The sum of all settings in the master (or basic) data represents a policy by which inventories and orders are filled, service levels are met and automation happens.
Very often there is a need for a concerted effort to keep master data clean, up-to-date and effective. A method needs to be put in place by which planners, schedulers and buyers will analyse, evaluate and update policies on a regular and continuous basis.
Competence
SAP usage competence is measured here. How much training for the user was received? What was the level of detail of the training? Is the system perceived to drive value? And is there user acceptance?
But we also need to measure how well general supply chain principles are understood.
Organizational Support
Further evaluations are necessary in order to determine the level of organizational support that is given to the SAP user. We consider of great importance that executives in the company, the people who made the decision to use SAP, are in full support of making the best use of the investment in SAP software. Therefore it’s of great value if the executives get involved to a fairly detailed degree and help support any improvement, sustainability and optimization projects around a better use of SAP software to drive the supply chain. This is a highly underestimated contributor to success.
Once all measurements are in, we can give an overall rating for each of the ten major KPIs and plot a spider diagram as seen below. The red line may depict the current performance, while the green line may give a target that needs to be achieved using various optimization efforts.

some of the optimization efforts that may drive your SAP supply chain towards your perceived targets can be:
- managing inventories using policies and exception monitoring
- optimizing availability checks and transfer of demand
- automating replenishment and procurement
- using better production / capacity scheduling methods
- introducing a system for materials planning & policy setting
- maintaining a usable KPI framework and reporting tools
- performing optimized S&OP and forecasting / rough resource checks
- using more integrated, standard SAP functionality for delivery and distribution
The ratings might not perfectly represent the actual situation - it is an approximation - but it's still so much better that moving in the dark and trying to find that magic handrail to guide you in the, hopefully, right direction.
Having a clear understanding of how your supply chain works is crucial to better business. Where are the bottlenecks? How are your vendors impacting your business? You need a 360 degree view of your supply chain so you ensure there are no lags or issues that hurt your bottom line in the long run.
ReplyDeleteThere are the ones which gets designed quite goodly in a way because finally that is the thing which helps us with learning more and at the same time Understanding business agility is pretty cool with that so yeah.
ReplyDelete