In the last part of this series, I’d like to begin with the
original question these blogs are trying to answer: Have we forgotten that an
ERP system implementation or roll-out is supposed to provide us with value? Or
are we simply content if the system is up and running and ‘kind of works’? Specifically,
when ERP systems are rolled out to plants or distribution centers globally, we often
see the ‘template’ approach, where transactions and processes are plugged in
without great consideration of value gain or improvements in terms of
efficiency, automation and transparency.
“Let’s get it up and running first and worry about the
details later”, is what I hear a lot. Is that detail really done after ‘go-live’?
More often than not, work-arounds, quick fixes and band aides are devised in
order to save the day. This is mainly due to the fact that focus quickly shifts
to keeping the business running. No one has time for a thorough system overhaul
as everybody is busy expediting,
On top of that, leadership is not keen spending more money
on “theoretical” promises when they had just spent exorbitant funds on the ERP
implementation.
This is all ok when the business works out and the results are
rolling in. The next question then is: what are good results? All too often we
hear “We have a service level of 95%. What’s the problem?” The problem is, that
in most cases those service levels are achieved through herculean efforts of
your heroes and none of it is due to the new (or now already old) ERP system.
Your company was already competitive before (otherwise you would not be in
business) and the ERP did absolutely nothing (or very little) to better that
situation. However, it did cost a lot of money and still does as it needs to be
supported and kept running. For what? So that you’re part of global
digitalization?
Enough complaining. Let’s talk solutions. Firstly, I believe
it’s never too late to optimize. But one has to be committed to focus on
value-based goal setting, with the awareness and acceptance that there is quite
some work to be done. Most importantly, and this is nothing new, we’ve got to
be willing to change. You can’t hang on to the stuff you know how it works. You
must have an open mind for transactions and processes you might have not
executed before or even heard about. And you must be willing to let go of old
structures and habits, no matter how hard and scary that might be.
It is not guaranteed that if you change things will get
better, but things will for sure not get better if you don’t change anything.
However, don’t get me wrong, I’m not saying you should
change everything no matter what. All I am saying is get prepared for change
and accept it if it’s based on a sound plan to get value-based results. There
are many ways to achieve that, and I am by far not claiming that my approach is
the best, but it is an approach. Without one you’ll most likely
get stuck.
As described in the previous blogs in this series we suggest
a 10 point plan of action:
1.
Devise a problem statement that brings about
clarity of your current situation, without being clouded by fixes and
work-arounds that keep us barely going.
2.
Analyze your current situation with effective
KPIs and clearly state your goals
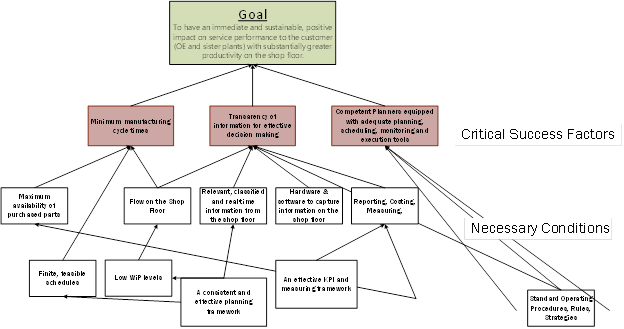
3.
Develop a goal tree with critical success
factors and necessary conditions
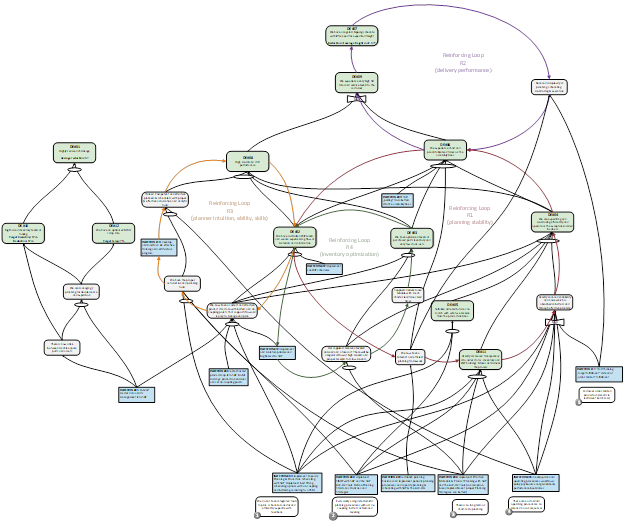
4.
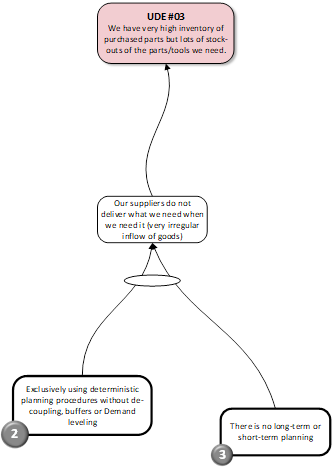
From it, and with your undesired effects,
construct a Current Reality Tree
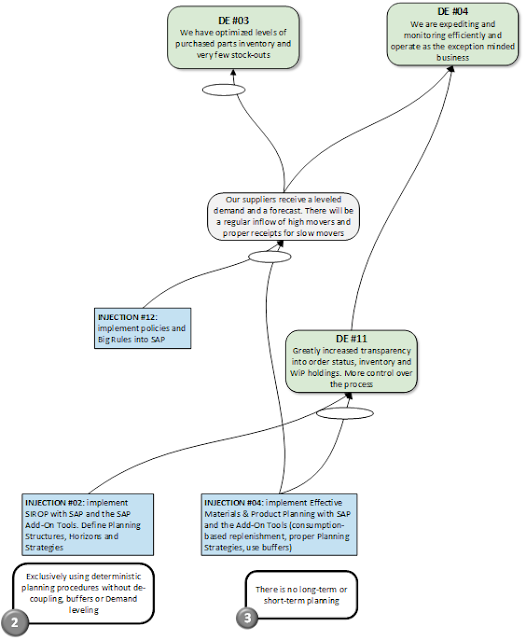
5.
Define Injections (activities and plans) that
help you turn the undesired effects into desired effects and describe those in
a Future Reality Tree
6.
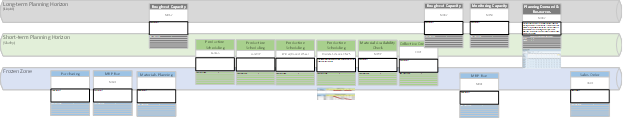
Develop your value streams and make them
transparent to all stake holders
7.
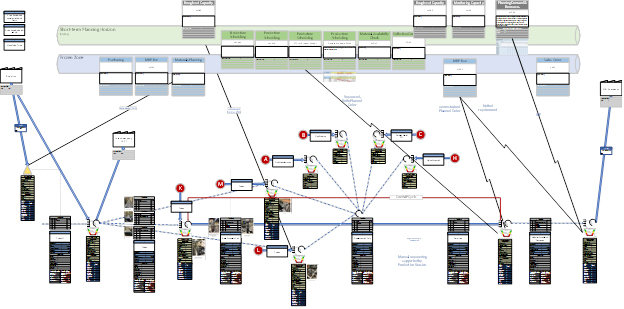
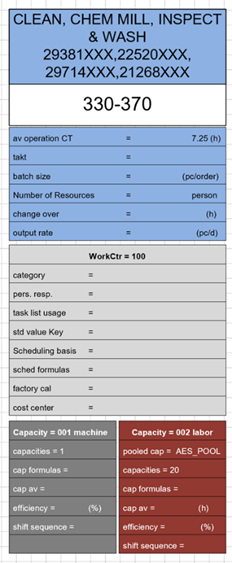
Work with SAP value stream maps to define
de-coupling points, planning and scheduling processes, master data and expected
results in terms of inventory holdings and service levels
8.
Develop a training program to communicate the
standardized processes and make sure everybody knows them and uses them for
sustainable, long-lasting results.
9.
Implement a culture of causality and value-driven
problem solving and get away from the “busy work” of utilization driven and event-based
thinking.
10.
Change! Then stay on course.
If you are looking for a good reason to do all this, just
think about the fact that purchasing and implementing an expensive ERP system,
without getting business value out of it, is like buying a race car and putting
it into the living room.
Getting Value and Results out of an ERP 1
Getting Value and Results out of an ERP 2