Monday, January 3, 2022

Getting Value and Results (5) out of an ERP System Part 5 (of 5): The Big Picture


In the last part of this series, I’d like to begin with the original question these blogs are trying to answer: Have we forgotten that an ERP system implementation or roll-out is supposed to provide us with value? Or are we simply content if the system is up and running and ‘kind of works’? Specifically, when ERP systems are rolled out to plants or distribution centers globally, we often see the ‘template’ approach, where transactions and processes are plugged in without great consideration of value gain or improvements in terms of efficiency, automation and transparency.

“Let’s get it up and running first and worry about the details later”, is what I hear a lot. Is that detail really done after ‘go-live’? More often than not, work-arounds, quick fixes and band aides are devised in order to save the day. This is mainly due to the fact that focus quickly shifts to keeping the business running. No one has time for a thorough system overhaul as everybody is busy expediting,

On top of that, leadership is not keen spending more money on “theoretical” promises when they had just spent exorbitant funds on the ERP implementation.

This is all ok when the business works out and the results are rolling in. The next question then is: what are good results? All too often we hear “We have a service level of 95%. What’s the problem?” The problem is, that in most cases those service levels are achieved through herculean efforts of your heroes and none of it is due to the new (or now already old) ERP system. Your company was already competitive before (otherwise you would not be in business) and the ERP did absolutely nothing (or very little) to better that situation. However, it did cost a lot of money and still does as it needs to be supported and kept running. For what? So that you’re part of global digitalization?

Enough complaining. Let’s talk solutions. Firstly, I believe it’s never too late to optimize. But one has to be committed to focus on value-based goal setting, with the awareness and acceptance that there is quite some work to be done. Most importantly, and this is nothing new, we’ve got to be willing to change. You can’t hang on to the stuff you know how it works. You must have an open mind for transactions and processes you might have not executed before or even heard about. And you must be willing to let go of old structures and habits, no matter how hard and scary that might be.

It is not guaranteed that if you change things will get better, but things will for sure not get better if you don’t change anything.

However, don’t get me wrong, I’m not saying you should change everything no matter what. All I am saying is get prepared for change and accept it if it’s based on a sound plan to get value-based results. There are many ways to achieve that, and I am by far not claiming that my approach is the best, but it is an approach. Without one you’ll most likely get stuck.

As described in the previous blogs in this series we suggest a 10 point plan of action:
1.       Devise a problem statement that brings about clarity of your current situation, without being         clouded by fixes and work-arounds that keep us barely going.
2.       Analyze your current situation with effective KPIs and clearly state your goals
3.       Develop a goal tree with critical success factors and necessary conditions
4.       From it, and with your undesired effects, construct a Current Reality Tree
5.       Define Injections (activities and plans) that help you turn the undesired effects into desired effects and describe those in a Future Reality Tree
6.       Develop your value streams and make them transparent to all stake holders
7.       Work with SAP value stream maps to define de-coupling points, planning and scheduling processes, master data and expected results in terms of inventory holdings and service levels
8.       Develop a training program to communicate the standardized processes and make sure everybody knows them and uses them for sustainable, long-lasting results.
9.       Implement a culture of causality and value-driven problem solving and get away from the “busy work” of utilization driven and event-based thinking.
10.   Change! Then stay on course.

If you are looking for a good reason to do all this, just think about the fact that purchasing and implementing an expensive ERP system, without getting business value out of it, is like buying a race car and putting it into the living room.

Getting Value and Results out of an ERP 1

Getting Value and Results out of an ERP 2

Getting Value and Results out of an ERP 3

Getting Value and Results out of an ERP 4

Getting Value and Results (4) out of an ERP System Part 4 (of 5): SAP Value Stream Mapping


Part 4 of the series addresses our ERP value stream mapping techniques. With it we go beyond traditional value stream mapping, in that we combine the material and information flows with specific settings we have to configure in the ERP system so that it can support the flow we intend to obtain. Since we often implement or optimize SAP ERP systems, I’d like to demonstrate SAP value stream mapping here.

Value stream mapping, also known as "material- and information-flow mapping", is a lean-management method for analyzing the current state and designing a future state for the series of events that take a product or service from the beginning of the specific process, until it reaches the customer. A value stream map is a visual tool, that displays all critical steps in a specific process, and easily quantifies the time and volume taken at each stage. Value stream maps show the flow of both materials and information, as they progress through the process. The difference between a value stream and a value chain, is that a value stream focuses only on areas of a firm, that add value to a product or service, whereas a value chain refers to all the activities within a company.

SAP value stream mapping follows the same principles and conventions that traditional value stream mapping does. Additionally, it adds SAP specific data and settings. On an SAP value stream map you can document lot sizing procedures and MRP type from the material master, work center category and capacity related information from work centers, identify production versions and routings to be used, define operation data from the routing with its cycle times, and much, much more. A finished SAP value stream map can serve as a complete documentation for a system architect, to set up all the functions, features and customizing settings, in order to run the value stream repetitively and effectively with SAP.

Additionally, to traditional value stream mapping, SAP value stream mapping adds pragmatism to the design process and allows for the immediate realization of the theoretical design.

First you design the inventory points. These also serve as de-coupling points as we will see later. An inventory point is defined in SAP as a material master record. Without a material master record, you cannot post a goods receipt of material into stock, and therefore, without a material master in SAP, there is no inventory in SAP. A stock or inventory point in a value stream map, is identified with a triangle and a capital I in it. Here we add two boxes with data to the triangle, to maintain SAP specific inventory and master data.


But inventory points must not be traditional stock alone. It can also be a supermarket, as used in lean projects. If the flow is set up as a self-organizing system, as in the case of Kanban or conwip, then we need a supermarket, from which an order can pull. Notice the icon for supermarket is a different one than the traditional stock point. However, the boxes below are the same. Except that here, you may maintain control cycle data additionally to the material master data.


Then we’ll design the material flow along work centers or machines. Notice that the flow happens between two inventory points. Eventually this flow will be described by a routing and then used in a production order. From upstream, the left side of the flow, raw materials or semi-finished product is issued and consumed to the order, and the downstream inventory point will receive the finished product from the order. Along the routing there are work centers and the activities, or operations which are executed on those work centers.


The work center box contains a description of the work center, and the work center’s SAP identification code. The blue box underneath the identification code contains performance data of the work center. Then there are the work center specific data settings like the work center category, standard value key, and the scheduling formulas, amongst other things, in the grey box. Lastly, you can identify what type of capacity may be used on that specific work center. Is it a labor capacity? A machine capacity? Or both. The capacity itself then, is also described by the respective data box.


Finally, we can also add the information flow to the map. All the planning, scheduling and monitoring activities are defined there.


These SAP value stream maps can become quite elaborate and detailed and therefore require a lot of effort to put together. We typically plot them on big posters, hang them up on the wall in the war room and go through various iterations as a team. The results are very rewarding in the long run, as you can readily pinpoint inefficiencies and device some strategies to improve all in one place.

Like mentioned before, if you put the work and focus into developing the SAP VSM, you’ll be compensated with a complete system documentation and a very solid basis for continuous improvements.

Getting Value and Results out of an ERP 1

Getting Value and Results out of an ERP 2

Getting Value and Results out of an ERP 3

Getting Value and Results out of an ERP 5

Getting Value and Results (3) out of an ERP System Part 3 (of 5): Achieving Clarity for a Roadmap to Success


In the following, we’ll discuss part 3 of the series on getting value out of your ERP system. Once you clearly stated the problem and carried out a thorough and useful analysis, you should then clearly define your goals and the desired effects you’d like to get out of a rather expensive ERP system, that looked so promising when you purchased it.

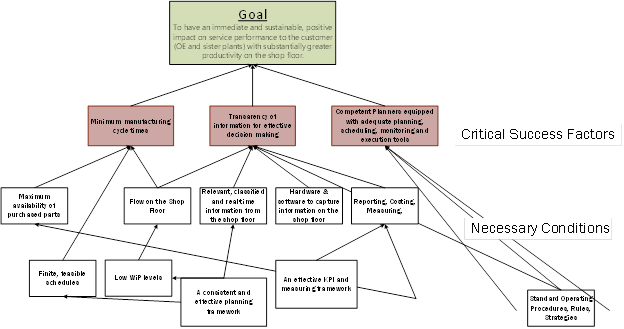
To develop a roadmap with all the activities necessary to achieve better results, we must first define what those results are supposed to be. A very systemic and logical approach to define quality results is William H Dettmer’s ‘Logical Thinking Process’. With it, Dettmer suggest defining a goal tree with critical success factors and necessary conditions.

A goal tree provides clarity about necessary conditions which must be fulfilled to use critical success factors to achieve the goal. It’s really worthwhile to spend a good amount of time defining the goal tree, as it serves the basis for the determination of the root causes for undesired effects.

Dettmer suggests listing the undesired effects with their causalities and then building a tree with an ‘IF… Then’ structure from the top down. As an example: one of the undesired effects is that we have high inventory of purchased parts, but still many stock-outs. One of the causes for that situation is that our suppliers don’t deliver what we need when we need it. This in turn can be caused by the fact that we plan exclusively deterministic and therefore order the wrong quantities too late. Another additive cause could be that we’re not planning, but only react to what we need right now.


Knowing now the causality tree, you can find and identify critical root causes. These critical root causes are then used to develop the Future Reality Tree.

In the FRT you go from the bottom up and use Injections (solutions) to break the negative causalities and turn undesired effects into desired effects.


If you do this using system thinking and logical causalities, you will be rewarded with a very clear picture about what needs to be done in order to achieve your goals. I find this extremely helpful in our optimization projects as it lays out a plan that you can use to define your road map, monitor your progress and measure your results.

In below graphic you can also see that the Future Reality Tree also shows those real effective reinforcing loops that are essential for sustainable success.


The approach which we’re discussing here requires time, effort and discipline. It’s not complicated but requires attention and focus. It is very contrary to the ‘band aid’ and ‘work-around’ problem fixing which so many apply. Dettmer’s Logical Thinking Process stems from and combines parts from the Theory Of Constraints and, maybe even more important, Systems Thinking and causal loops. These are thinking and problem-solving techniques which look at the Big Picture and strive to solve problems holistically, considering and avoiding unintended consequences.

Getting Value and Results out of an ERP 1

Getting Value and Results out of an ERP 2

Getting Value and Results out of an ERP 4

Getting Value and Results out of an ERP 5


Getting Value and Results (2) out of an ERP System Part 2 (of 5): Assessment and Analytics


In part 1 of this series, we asked the question about getting value and results out of an ERP implementation or optimization. In this part I’d like to present the tools and analytics we apply to assess a current situation in terms of productivity, efficiency, automation and inventory performance.

Naturally, if one wants to improve an unsatisfactory situation, one must have a clear picture of the current situation. We need to know where we stand before we can think about activities to improve and better our positions. But what are the Key Indicators which tell us how we perform?

One of the key measures in production is ‘flow’. When materials and orders don’t flow, they cause long lead times, high levels of Work in Process, bad fill rates and constant re-scheduling is required. To generate flow is why capacity planning and production scheduling is done in the first place. If you don’t do it right, it is impossible to flow the orders through the shop floor. And since a lot of companies (at least many I worked with) don’t use their ERP system effectively to generate a periodic schedule, there are a lot of shop floors out there which don’t flow well.

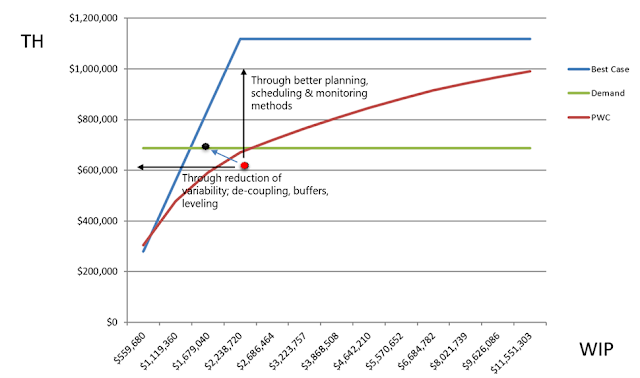
So how can you measure the degree of flow you have on your shop floor? I recommend reading Factory Physics (by Spearman and Hopp) from which I borrowed what I believe is an excellent method: flow benchmarking. With flow benchmarking you can determine how well your production is using inventory to deliver high Throughput and short Cycle Times. Flow benchmarking uses Little’s Law to relate Revenue (Throughput) with average Inventory holdings (WIP) and Lead Times (or Cycle Times) and provides an excellent opportunity to calculate a third variable when two are measurable. It shows how well materials flow and is an brilliant tool to set a WIP cap in a pull system.

In the example provided, we can see that the shop floor is currently operating in the bad zone (the red dot) which is below the Practical Worst Case (PWC). In fact, they require approximately 2 million worth of work in process to deliver an output worth just above 600k. That output however, does not cover the demand of 640k. In short, they’re consuming too much inventory, to achieve an output which doesn’t even cover demand. We can also see that capacity is not the problem. The maximum capacity available is defined by the blue line. (flow benchmarking also includes the Lead Time, which is not shown in the example)

What we should deduce from this measure, is that we must move the dot to the left and up. That would move us into the lean zone, where we start generating more output with less input (WiP). How can you do that? Reducing variability through the correct setting of de-coupling points and using buffers moves the dot to the left, and the implementation of better planning and scheduling will move the dot upward.

Another important measure we must get clarity about is our ability to fulfill customer demand. This measure should focus not only on fill rates or service levels, but also on how flexible we can react to changing demand patterns. I’ve seen many variations of this KPI, with many different input and output parameters. In the end, what counts is how happy your customers can be with the reliability of your delivery. Of course, there are limits as to how much variability in demand you can swallow. Therefore, you must lay down some rules so that everyone – up and down the supply chain – has clarity about what to expect. This includes a clear definition about what you offer right from stock and what you offer to an order with a predetermined lead time the customer must accept.

Consequently, we measure service level (or fill rate for MTS) separately for MTS from MTO. This sounds simple and logical, but I’m often surprised that when I ask planners which parts they classify as MTS and which ones as MTO, they can’t give me a clear answer.

Another important aspect in the measurement of service is to know how much variability we add ourselves. “Why would we add variability to an already noise-laden process” you might ask. Well, you certainly don’t add variability on purpose, but it happens through a myriad of ineffective ways. Deterministic planning, unnecessary deep Bills of Material, incorrect use of de-coupling points and the lack of clearly defined rules are just a few practices that add deteriorating variability into the process.

That is why we also like to measure possible sources of inefficiencies, so that we can device solutions which reduce noise and increase productivity. Like in the following example, we have analyzed the product structure and how it was built into the ERP (BoM, routings, inventory and scheduling points)


As can be seen in above graphic, the more inventory and scheduling points there are, the more variability can (and will) occur. And every time there is variability, the system degrades, leaving you with bad fill rates in the end.

Of course, there are many more KPIs, like fill rate or service level, inventory measures and utilization which I cannot sufficiently cover in a blog post, but if I may make one recommendation here: don’t evaluate the KPI’s separately. Always look at them in the context of the other and the big picture. Sometime one KPI is in direct conflict with another (e.g. the desire for high resource utilization is in direct opposition with flow when variability is present).

Naturally, the more clarity you’ll get out of the analysis, the better your position for improvement.  

Getting Value and Results out of an ERP 1

Getting Value and Results out of an ERP 3

Getting Value and Results out of an ERP 4

Getting Value and Results out of an ERP 5

Getting Value and Results (1) out of an ERP System. A new Concept? Part 1 (of 5)

Do you know the story of the company who decided to acquire and implement an ERP system? It was sometime between 1990 and 2020 that their leadership wanted to modernize their process landscape and participate in the global quest for digitalization. A task force was put together and Requests for Quotation were sent to various System Integrators. Then, in elaborate meetings, the consultants demonstrated their experience and capabilities with the functionality and intricacies that an ERP implementation required.

Shortly thereafter, the best presenter was selected, and an implementation project put together, consisting of experienced consultants and super users from the client. Interviews were performed and the current processes and activities were captured, documented and translated into the new system. As the company wanted to implement in multiple manufacturing sites and distribution centers around the world, a template was defined for a speedy roll-out. That template included configuration settings, master data specifications and a lot more that made it easy for IT to plug the new system into any of the sites out there.

So far so good. “We’re getting a new system which is integrated, modern, sophisticated and will catapult us into the elite club of digitalized companies out there”, was the initial consent between business leadership and IT.

Fast forward to 5 to 15 years after Go-Live:
·       The company’s IT still runs the ERP system.
·       Planning, Scheduling and Monitoring of Production is executed in an abundance of very sophisticated spreadsheets
·       Planning and replenishment of inventories for purchased parts in the plant and finished goods in the DC is done through constant expediting and rescheduling of orders, because the ERP is incapacitated by thousands of daily exception messages and an abundance of noise and the constant beating by the bullwhip effect.
·       Every now and then another plant or distribution center is implementing the template
·       A new culture has developed: suddenly, there are “gurus” running the show. The gurus have figured out how that new system works from the underbelly. They fix every problem and become the heroes of the moment. No problem is big enough for them to not have a work-around, another spreadsheet or a third-party solution as a quick fix. Nobody dares to question them, and they are indispensable to the business.
·       Business runs as usual. It’s not worse and not better than before the implementation of the ERP system. They still have inventory problems, stock-outs and mediocre fill rates or service levels. But they have the gurus now. And the gurus fix what needs to be fixed.
·       What’s really worrisome is the sheer number of manual interventions necessary to fulfill customer demand on time and on quantity, when so much money was spent on the ERP with the expectation of automation and visibility.

On the company went and intended to implement the ERP system in another location. However, that location was threatened by global supply chain problems and other economic forces. Therefore, this time, leadership of the company expected some value coming out of the implementation. That was new and unexpected. IT had already engaged with a consultancy and the template was already groomed and ready for roll-out. Interviews with stakeholders had already been performed and it was clearly defined how the old processes (the ones that produced bad results) were perfectly copied and orchestrated into the ERP system (which was now mainly driven by spreadsheets).

This was a problematic situation. People on all levels were confused. “Wasn’t this ERP system supposed to deliver value in the first place?” “We implemented so many plants before. Why should we do it differently now? It was working before. Wasn’t it? And if it wasn’t working before, why didn’t we do anything about it?”

The most telling question, however, was the following: “We didn’t know that a roll-out of the ERP should actually deliver value and better results. We have always implemented to get the system up and running. And that was always our measure of success.”

I am sure there are many companies out there who do much better, but for those who can see themselves in a similar place, I’d like to provide some suggestions based on our experiences and the methodologies we have developed over the years.

This series of blogs contains 5 parts. The first one is the problem statement you just read. Next, I’ll go into how we perform assessments and analyze a current situation. Part 3 is all about logic trees and how systems thinking can help turning undesired effects into desired effects. Then, in part 4 we discuss our SAP value stream mapping and how it can help with the realization of value. Finally, in part 5 we attempt to put the pieces together to show how you may achieve considerable change and significant value in a sustainable manner.

Getting Value and Results out of an ERP 2

Getting Value and Results out of an ERP 3

Getting Value and Results out of an ERP 4

Getting Value and Results out of an ERP 5

Sunday, July 25, 2021

Inventory… how much is too much?


Have you ever talked to a materials manager who was content with their inventory holdings? I didn’t think so. Have you ever met one who can tell you why they’re not content? They can probably tell you that they have too much inventory (and still the occasional stock-out) but when you ask them how much is too much, they’re sometimes getting a little fuzzy. 

In my personal opinion there are too many (confusing) inventory KPIs around. For years I’ve been searching for the one KPI which tells the whole story, but that is an ambitious effort which didn’t get me anywhere. After many frustrating attempts to make sense out of turn-overs, averages, days of supply, dead stock and many other measures, I decided to re-think my approach and challenged my mental model about inventory analysis.

Traditionally, inventory is measured by a set of KPIs, which do not all make sense by themselves. Take ‘dead stock’ for example. If you find out that your purchased parts have a dead stock value of US$ 300,000.- over the past 6 months, will you be happy? What if your inventory management system provides a report that says you have an average of 53 days of supply on the 567 finished products you hold in your warehouse? 75% of those are high runners which you should produce to a forecast and the rest is made to a customer order. So what of those 53 days of coverage is right and which part is not? Then you see that you held an average of US$ 1,350,000 on your raw materials. Was that enough to buffer variability? Did the stock-out occur on materials that had low inventory throughout, or did you experience bi-modal inventory swings and had materials that went from too little to too much and around again?

It’s very difficult to derive improvement actions from those KPIs. Some managers then develop strategies out of frustration. In one case, a planner decided that the only way to avoid stock-outs is with excess inventory at all times. What in the beginning was opposed with little skepticism, established itself in the long run. The whole company, including its executives, settled on the mantra that too much inventory is a good thing – it avoids stock-outs – and if anything goes wrong it’s the fault of the supplier. They went as far as – unconsciously – propping up inventory by using static safety stocks. You know, when you use a static safety stock, that quantity is taken out of the plan and becomes invisible. It raises the zero line to the level of the safety stock. It just worked for what their thinking was: more inventory is better.

So here you are,  ending up with inventory you don’t need and still experiencing stock-outs. And the inventory KPIs dead stock, average inventory, turns, days of supply etc. do nothing to help you to know what to do.

How about looking at some action KPIs? But before we do that, we’ll have to lay down some rules. In my mind, the biggest fallacy in planning, is that rules aren’t defined. I have been writing about chance-based and rule-based planning systems before. It still is a mystery to me why people accept that there are rules in traffic, in sports and in every aspect of social life, but when it comes to planning, we slack off and excel in rogue behavior being defined anew every time we have a suboptimal situation.
The rules I am talking about here must certainly not be the ones you are going by. But they are rules that work for me and I use them every time until I find a better way to achieve better results. But until then, those rules stand for me. Specifically, some of these are:

- Out of the sellable products portfolio, those products that exhibit regular sales pattern from period to period and are high movers are made to stock by a forecast and buffer variability to a certain extend with a dynamic safety stock
- Out of the sellable products portfolio, those products that exhibit irregular, unpredictable sales are only made when we have a customer order and we do not hold inventory of those.
- However, some of the ladder is worthwhile stocking a bit (especially when they have a long replenishment lead time), whilst others (expensive with short lead times) we don’t stock at all.

After these rules are defined, I can now measure whether I carry the right amount of inventory. I do so looking at the products from the first rule separately from the products adhering to the second rule. Measuring becomes relatively easy. For product that we make to order, we should not carry inventory. If there is, it’s either because I need to produce to a lot size and have a little left over, or that I falsely maintained a safety stock or have a consumption-based planning method on some products – in other words… I broke the rule and must fix it.

But according to rule three there are some parts that I do hold in stock because they are hard to replenish and are not very expensive. Those should be measured according to the Days of Supply. If I have adequate inventory to just not run out during the lead time, I’m good. I don’t need more than that, so use a matrix that shows which ones of those items have more or less days of supply than their specific replenishment lead time.

For the high movers I compare the total current or average inventory that I am holding to the total average, periodic (weekly or monthly) consumption (Sales). Is my inventory holding more than 3 times as high as its consumption, I know I have more inventory than I need and must fix the policy by which I replenish. To compare the actual inventory you are holding (of your high runners) to an average periodic consumption is a very precise indication of whether you carry too much or too little. Think about it… you don’t want to hold less than what you’re selling, but you also don’t need much more than what you’re selling. The excess over your actual sales is the buffer. So the buffer size is driven by the amount of variability you think you will encounter.

This type of measuring and monitoring makes you think about how you should plan for the future. Most planners are driven by forecast accuracy and therefore hellbent on bringing exactly in what they think how much they need (forecast) and exactly when they need it (forecast). I think that is a fruitless and frustrating behavior. If you measure the buffer you are holding you are driven to think how much buffer you need in the future to absorb variability. So how do you come up with the right buffer size? Instead of predicting the forecast to the tee, you anticipate variability and try to predict how much will come at you. Then you have an inventory target that might be a little high because you are careful not to miss any sales.

But a buffer that ends up being 15% higher than what you predicted as variable is a world better than ending up with 10 times as much inventory as you need. 

The point I’m trying to make here, is that before we can make an educated guess about the right amount of inventory that is held in the warehouse, we must lay down some rules. Simply running some inventory KPIs through your portfolios doesn’t do the trick. I am sure this isn’t a new revelation for most of you, but I do see a lot of inventory systems and I haven’t come across a fully rule-based system yet. Why is that? I believe that it has to do with long held beliefs, mental models, stubbornly holding on to what was always valid. And if the whole company beliefs that the only way to avoid stock-outs is to accumulate huge amounts of inventory, why would anybody dare to plan otherwise.

Time to change the way we think about inventory management.


Friday, January 31, 2020

It's a new day... let's fix our inventory

How do you go about inventory optimization on a daily basis? I hope it's nothing like the following...

Unfortunately, for lack of a rule-based system, this kind of planning and behavior can be observed more often than not. Of course, it is not quite so bad as described in above flow chart, but there are many close variations to it, in many plants and DCs around the SAP (or other) ecosystem.

implementing rules to your inventory monitoring and optimization system is an essential part of effectively managing inventories and providing high fill rates, but even more important - at least I believe so - is that you manage by exception and not randomly. Managing randomly means that you pick your candidates every day and see what's up. Much like in the flow chart here. Managing by exception means that you let the system decide what you're looking at, according to the rule that you gave the system (e.g. alert me when a fast moving, consistently consuming part that is expensive and has a long replenishment lead time exceeds 20 days of supply).

in my workshops or blog posts, I often talk about working on the system instead of in the system. What happens in above flow chart, is that the planner works in the system - expediting and firefighting randomly and almost the entire work day. That planner works for his/her inventory management system. Alternatively (and much more effectively) one could work on the system - making sure that the basic data, or policy, can enable the system to work for you.


Maybe, you can think more along the lines of the following...(as you can see, I'm not taking away from you the ability to still surf the internet)


Saturday, November 2, 2019

Rule-based Planning and why SAP often doesn't deliver the results we expect

Most organizations consider the planning of their sellable products and materials an important part of their business strategy, but the way it's being executed makes one feel that the outcome is rather coincidental or random.

If you, as a planner, have to resort to massive expediting, fire-fighting and constant responding to rush requests from sales and / or production, then chances are you're operating within such a chaotic, lawless, rogue system. Should you use SAP software to manage inventory and replenishment, you typically work with Excel spreadsheets, your most used transaction - by far - is MD04, almost all your finished products and raw materials are setup with MRP type PD and your entire day is filled with correcting orders, chasing POs and taking in angry emails from people who want stuff.
Most planners, buyers, MRP controllers I work with, believe that this is the way it has to be... one has accepted their fate and does their best to keep the situation at barely the minimum it needs to run, so as to not completely break down.

Oddly enough, management usually doesn't do much about it. This situation is considered normal and people think there's not much they can do. "We bought SAP to automate planning, IT implemented it, so what else can we do?" I hear a lot. Yes, SAP has been implemented. so much is true. But nothing else has happened. And by now, so many years into implementing SAP, we should know that implementing the software is only part of the endeavor. What's by far more important is that we're in this to improve processes and operations... better inventory levels, higher service or fill rates, more automation, less noise. However, and please tell me if I am wrong, those things are often forgotten and after the implementation we're operating the same way as before... only with SAP now.

So what can be done? Well, the best way to get out of a random system is to proactively laying down some rules which generate predictable outcomes. Like any administration is driven by policies and rules, your planning department should also be guided by principles, policies and rules. For example, a football coach publishes a playbook by which everybody knows what to do in a given situation so that the outcome is more predictable and less random. Much in the same way it should be clear that when a product has a long replenishment lead time, sells in high volumes and very predictably, one should hold some inventory so that the customer does not have to wait when they place an order.
Building this kind of rule based material and product planning into SAP can be done using the SAP Add-On Tool „MRP Monitor“. The tool is developed in the SAP namespace by SAP and supported by SAP. It’s an extension of ECC 6.0 and also runs in S/4 HANA. 

The MRP Monitor provides a number of functions: it can analyze and organize all of a plant‘s materials (I ran it for an excess of 100,000 materials at a time). While it does that, it can also perform a segmentation into up to 9 segments (ABC, XYZ, EFG, PQR etc.). The classes each material is assigned to, is then temporarily saved in a new material master screen that comes with the monitor. 
Then there is the rule (or policy) table (also included in the package). In it you save the rules, the master record setups to support the rule and the logic from the decision tree.

Now the system takes over. You’ve done the part the human must do (until AI comes around) defining the rules and publishing it to the system. From then on the system will keep the data par to the rules you defined. This happens automatically (or step by step if you feel like you have to watch it initially) and regularly. 

You see? All of a sudden your system transformed to become rule based. Green means go... red means stop. No questions asked. And everyone throughout the organization goes when the light is green and stops when the light is red. 

Gone are the days when every planner had to decide on their own how to set the basic data, how or if to accumulate inventory and when to order how much for the replenishment. 
No one knows what exactly will happen in the future, but organizing yourself into rule-based planning will give you a much better chance to predict and control desired outcomes. 

Monday, November 5, 2018

Why digitalization can't fix your supply chain problems


There's a pretty good chance that when you asked for a solution to your supply chain problems, someone brushed you off saying "don't worry, we're digitalizing soon". Just look at all the software vendor's marketing pitches, browse discussion groups and networks on the internet, listen to analysts and consultants... more often than not digitalization is perceived to be the holy grail. While writing this post I called up LinkedIn and the second post had the following text:

"Delighted to host the <name left out> workshop with more than 30 top customers in <location left out>. Focus on <software vendor left out> Digital Supply Chain Product Strategy and tangible business use-cases for Intelligent Technologies like IoT, Machine Learning and Blockchain. Thank you for your participation and insightful discussions. hashtag#digitalsupplychain "

The 3rd and 5th article were similar but I simply want to point out that the talk about digital supply chains is over proportional compared to the necessary talk about human factors influencing the outcome of planning. Undoubtedly, digitalization is coming and it certainly is necessary, however, my point here is that by simply digitalizing your supply chain or shop floor or company or whatever, you're not brushing away the problems inherent to supply chain dynamics.

In my opinion digitalization or, as it was previously called, software implementations will get you two primary benefits:
- process automation and standardization to free a planner's time away from doing busy work
- improved quality of information which allows the planner to make decisions that the machine (that digital thing) is not good at making

Now many of you will say "but the machine is now intelligent... " Really? Are we there yet? Then our manufacturing and distribution companies can be solely run by IT departments (they are already anyway) and we don't need planners anymore? The VUCA world (Variability, Uncertainty, Complexity, Ambiguity) is real and unfortunately (or thankfully) we're still dependent on the excellent functioning, very creative and immensely intelligent human brain. Humans are still making decisions and are still running the show. Machines are still stupendous data crunchers but they're very good at that.

Let's remain flat footed and not exaggerate what digitalization can do for us. Except, of course, if you're making a living selling digitalization. But for the rest of us... those that struggle to keep the right inventory at the right place in the right quantity at the right time, let's use the machines (and software and all things digitalized) for what the are good at...

- automating so we have more time to work and think analytically and make good decisions
- increase the quality of data we use to make decisions so that we make better decisions

...and further our knowledge and experience with the dynamics of a supply chain, so we can effectively use our brains to fight the challenges we're faced with by the VUCA world.

Intelligent, experienced and effective planners are still rocking the supply chain world! Let's work on raising good, effective human planners too... spend some of the digitalization budget on the human factor... it pays.